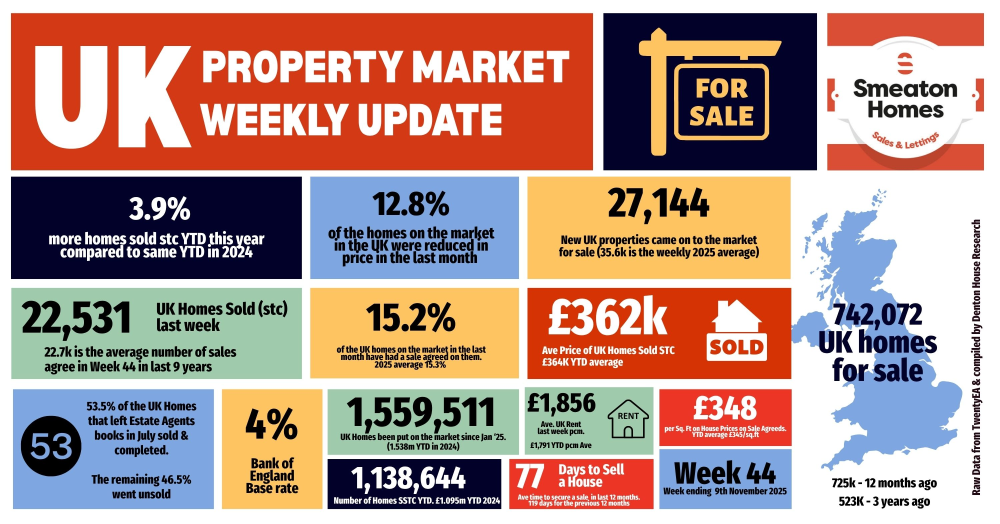
Stats for Week 44 of 2025
✅ New Listings
• 27.1k new properties came to market this week, down as expected from 27.5k last week.
• 2025 weekly average: 35.6k.
• 9 year week 44 average : 28k
• Year-to-date (YTD): 1.56m new listings, 1.4% higher than 2024 YTD (1.54m) and 8.9% above the 2017–19 average (1.43m)
✅ Price Reductions
• 18.5k reductions this week, slightly higher than last week’s at 18.3k.
• Decrease in the number of homes on the market as 12.8% of resi homes for sale were reduced in October. Compared to Sept 14.1%, August 11.1%, July 14.1% in July and 14% in June.
• 2025 average still remains at 13.2%, versus the five-year long-term average of 10.74%.
✅ Sales Agreed
• 22.5k homes sold subject to contract this week, down as expected from 23.5k last week.
• Week 44 average (for last 9 years) :22.7k
• 2025 weekly average : 26k.
• YTD: 1.137m gross sales, which is 3.9% ahead of 2024 (1.096m) and 12.5% above the 2017–19 average (1.012m).
✅ Price Diff between Listings & Sales
• Average Asking Price of listings last week £400k vs Average asking price of Sales Agreed (SSTC)- £362k - a 10.6% difference (long term 9 year average is 16% to 17%)…
• The average listing price has dropped from £452k in Sept to £415k in October.. ie fewer expensive homes being listed
✅ Sell-Through Rate
• 15% of homes on agents’ books went SSTC in September. Up from 14.1% in Sept, 14.5% in Aug, 15.4% in July, 15.3% in June, and 16.1% in May.
• Pre-Covid average: 15.5%.
✅ Fall-Throughs
• 5,975 fall-throughs last week (pipeline of 510k home Sold STC).
• Weekly average for 2025: 6,182.
• Fall-through rate: 26.5%, slightly up from 24.2% last week.
• Long-term average: 24.2% (post-Truss chaos saw levels exceed 40%).
✅ Net Sales
• 16.6k net sales this week, down (as expected) from 18.2k last week.
• Nine-year Week 44 average: 16.9k.
• Weekly average for 2025: 19.7k.
• YTD: 867k, which is 3.4% ahead of 2024 (839k) and 9.4% above 2017–19 (793k).
✅ Probability of Selling (% that Exchange vs withdrawal)
• Initial October Stats : 53.5% of homes that left agents’ books exchanged & completed in October. (Note this figure will change throughout the month as more October comes in)
• September: 53.1% / August :55.8% / July: 50.9% / June: 51.3% / May: 51.7% / April: 53.2%.
✅ Stock Levels
• 742k homes on the market at the start of November, 2.4%% higher than November 2024. (725k)
• Notable increases include 9% more homes for sale in London than 12 months ago (9.96% in Inner London & 9.03% in Outer London) & 5.48% in the South East and 5.02% in the South West. The North has seen a drop in homes for sale.
• 511k homes in sales pipeline on the 1st November, 2.2% higher than 12 months ago.
If you would like to chat about our local property market, feel free to drop us a line on 01752 222060 or email us on info@smeatonhomes.co.uk

