Are There More Homes for Sale in Plymouth?
A Comparable Map between October 2025 and October 2024
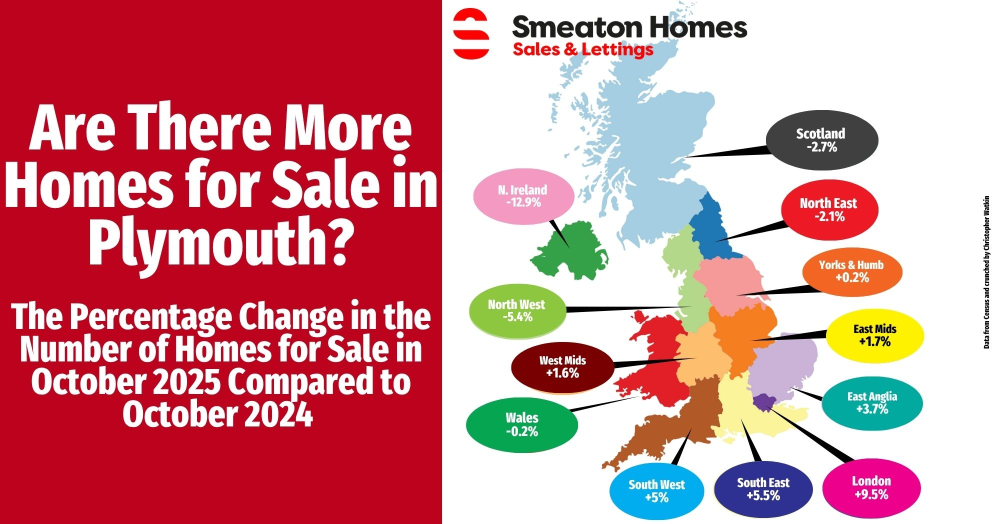
The data shows an intriguing north-south split in the UK housing market.
Here’s how the regions compare for the change in the number of homes for sale in October 2025 versus October 2024:
· London: +9.5%
· South East: +5.5%
· South West: +5.0%
· East Anglia: +3.7%
· East Midlands: +1.7%
· West Midlands: +1.6%
· Yorkshire & Humber: +0.2%
· Wales: -0.2%
· North East: -2.1%
· Scotland: -2.7%
· North West: -5.4%
· Northern Ireland: -12.9%
More homes are coming onto the market in the South, particularly in London and regions around it, where the number of homes for sale are up sharply.
Is that a reflection of the higher house prices and cost-of-living pressures in those regions as household budgets are tight, homeowners with larger mortgages and higher running costs often move first?
Or is it the opposite, more people are wanting to move because they are more confident? Or could it be they may be downsizing, relocating for affordability, or simply deciding to sell while prices remain relatively strong? Greater supply means house price growth could be muted in 2026? Meanwhile, much of the North is seeing stock levels tighten, suggesting fewer people are choosing or needing to sell.
What do you think? What do you think this means for the Plymouth property market? Let us know by sharing your thoughts at info@smeatonhomes.co.uk