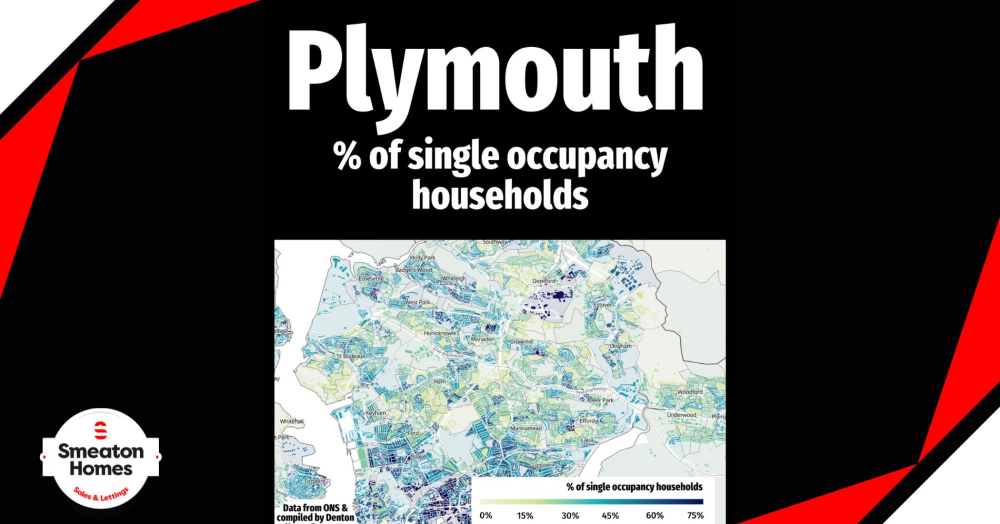
The Percentage of Homes that are Single Occupancy
This map shows the percentage of single occupancy households across Plymouth.
The darker shades highlight neighbourhoods where a higher proportion of homes are lived in by one person. The lighter greens indicate areas where single occupancy is less common, and households are more likely to include couples or families.
Single occupancy can mean very different things. At one end of the spectrum, it often reflects the start of adult life. Younger residents living independently for the first time, those in education, people in smaller one- or two-bedroom flats, or shared houses with individual tenancies. These households bring energy, mobility and change, often linked to work, study and early career moves.
At the other end, single occupancy can represent later life. Long standing residents whose children have moved out. Widows and widowers remaining in the family home. Individuals who have chosen to stay rooted in the community they know well.
What this map really illustrates is the diversity within Plymouth. Behind each shaded block is a different story, a different stage of life, a different housing need. Together, they form an eclectic and evolving mix of residents, which is part of what gives any town or City in the UK its character and resilience.