The Rent in Plymouth since 2016
We all know rents have risen since 2016.
But once you adjust for inflation, the picture looks very different. Nominal growth tells us what the numbers say on paper. Inflation adjusted growth tells us what it feels like in people’s pockets.
Here’s how it breaks down, region by region:
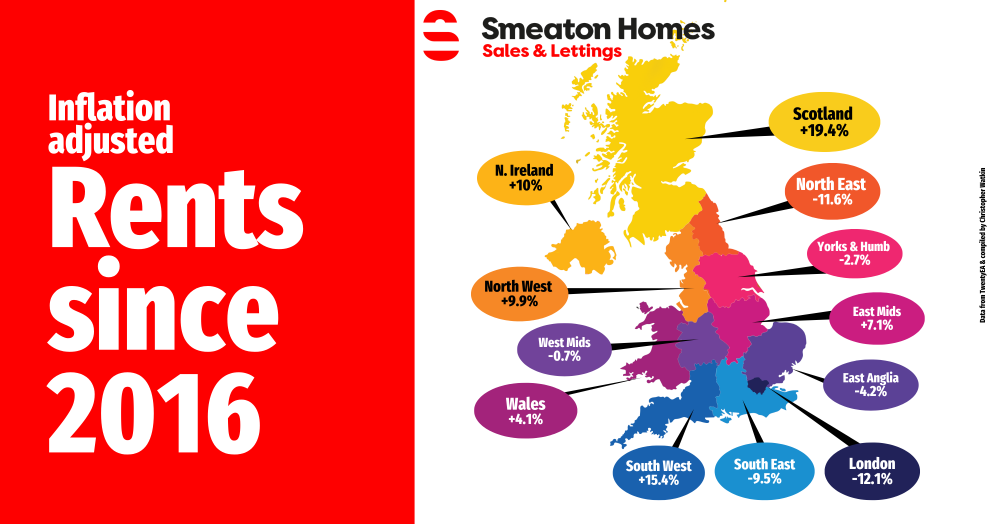
· Scotland: +54.6% (inflation-adjusted +19.4%)
· South West: +50.6% (inflation-adjusted +15.4%)
· N. Ireland: +45.2% (inflation-adjusted +10%)
· North West: +45.1% (inflation-adjusted +9.9%)
· East Midlands: +42.3% (inflation-adjusted +7.1%)
· Wales: +39.3% (inflation-adjusted +4.1%)
· West Midlands: +34.5% (inflation-adjusted -0.7%)
· Yorks & Humber: +32.5% (inflation-adjusted -2.7%)
· East Anglia: +31.0% (inflation-adjusted -4.2%)
· South East: +25.7% (inflation-adjusted -9.5%)
· London: +24.1% (inflation-adjusted -12.1%)
· North East: +23.6% (inflation-adjusted -11.6%)
The key takeaway is this: headline rental growth does not always mean tenants are worse off or landlords better off. In London, nominal growth of over 20% translates into a fall of more than 12% once inflation is accounted for. Meanwhile in Scotland, rent increases of nearly 55% still stand up as almost 20% higher in inflation-adjusted terms.
So, what does affect rents? In the most part, rents are tied to wages and wage growth.
If you would like to learn more about this topic, feel free to leave us an email at info@smeatonhomes.co.uk